Aerial Thermal
Solar Inspection
Calibrated radiometric thermal imaging across your full installation. Every anomaly identified, classified, and mapped — delivered as a report your maintenance team can act on directly.
Why Thermal Imaging
Many array defects — hotspots, failed bypass diodes, cracked cells, delamination, soiling patterns — produce no visible indication from the ground. They show up clearly in calibrated thermal data, often revealing issues that have been degrading output for months.
Ground-level spot checks with handheld IR cameras are time-intensive and limited in coverage. An aerial thermal scan captures your entire installation in a single session, providing a complete picture that targeted methods can't match.
What We Find
Hot Spots
Individual cells or groups overheating due to internal defects, cracking, or manufacturing issues. Left unchecked, these degrade surrounding cells and can become fire risks.
Failed Strings
Entire strings running at reduced output or completely offline. Often caused by failed bypass diodes, broken interconnects, or inverter issues.
Underperforming Modules
Panels producing below expected output due to degradation, PID, soiling, or partial shading. Thermal signatures pinpoint exactly which modules need attention.
Physical Damage
Cracked glass, delamination, snail trails, and mechanical damage visible in both thermal and RGB imagery. Documented with location data for warranty claims.
See the Difference
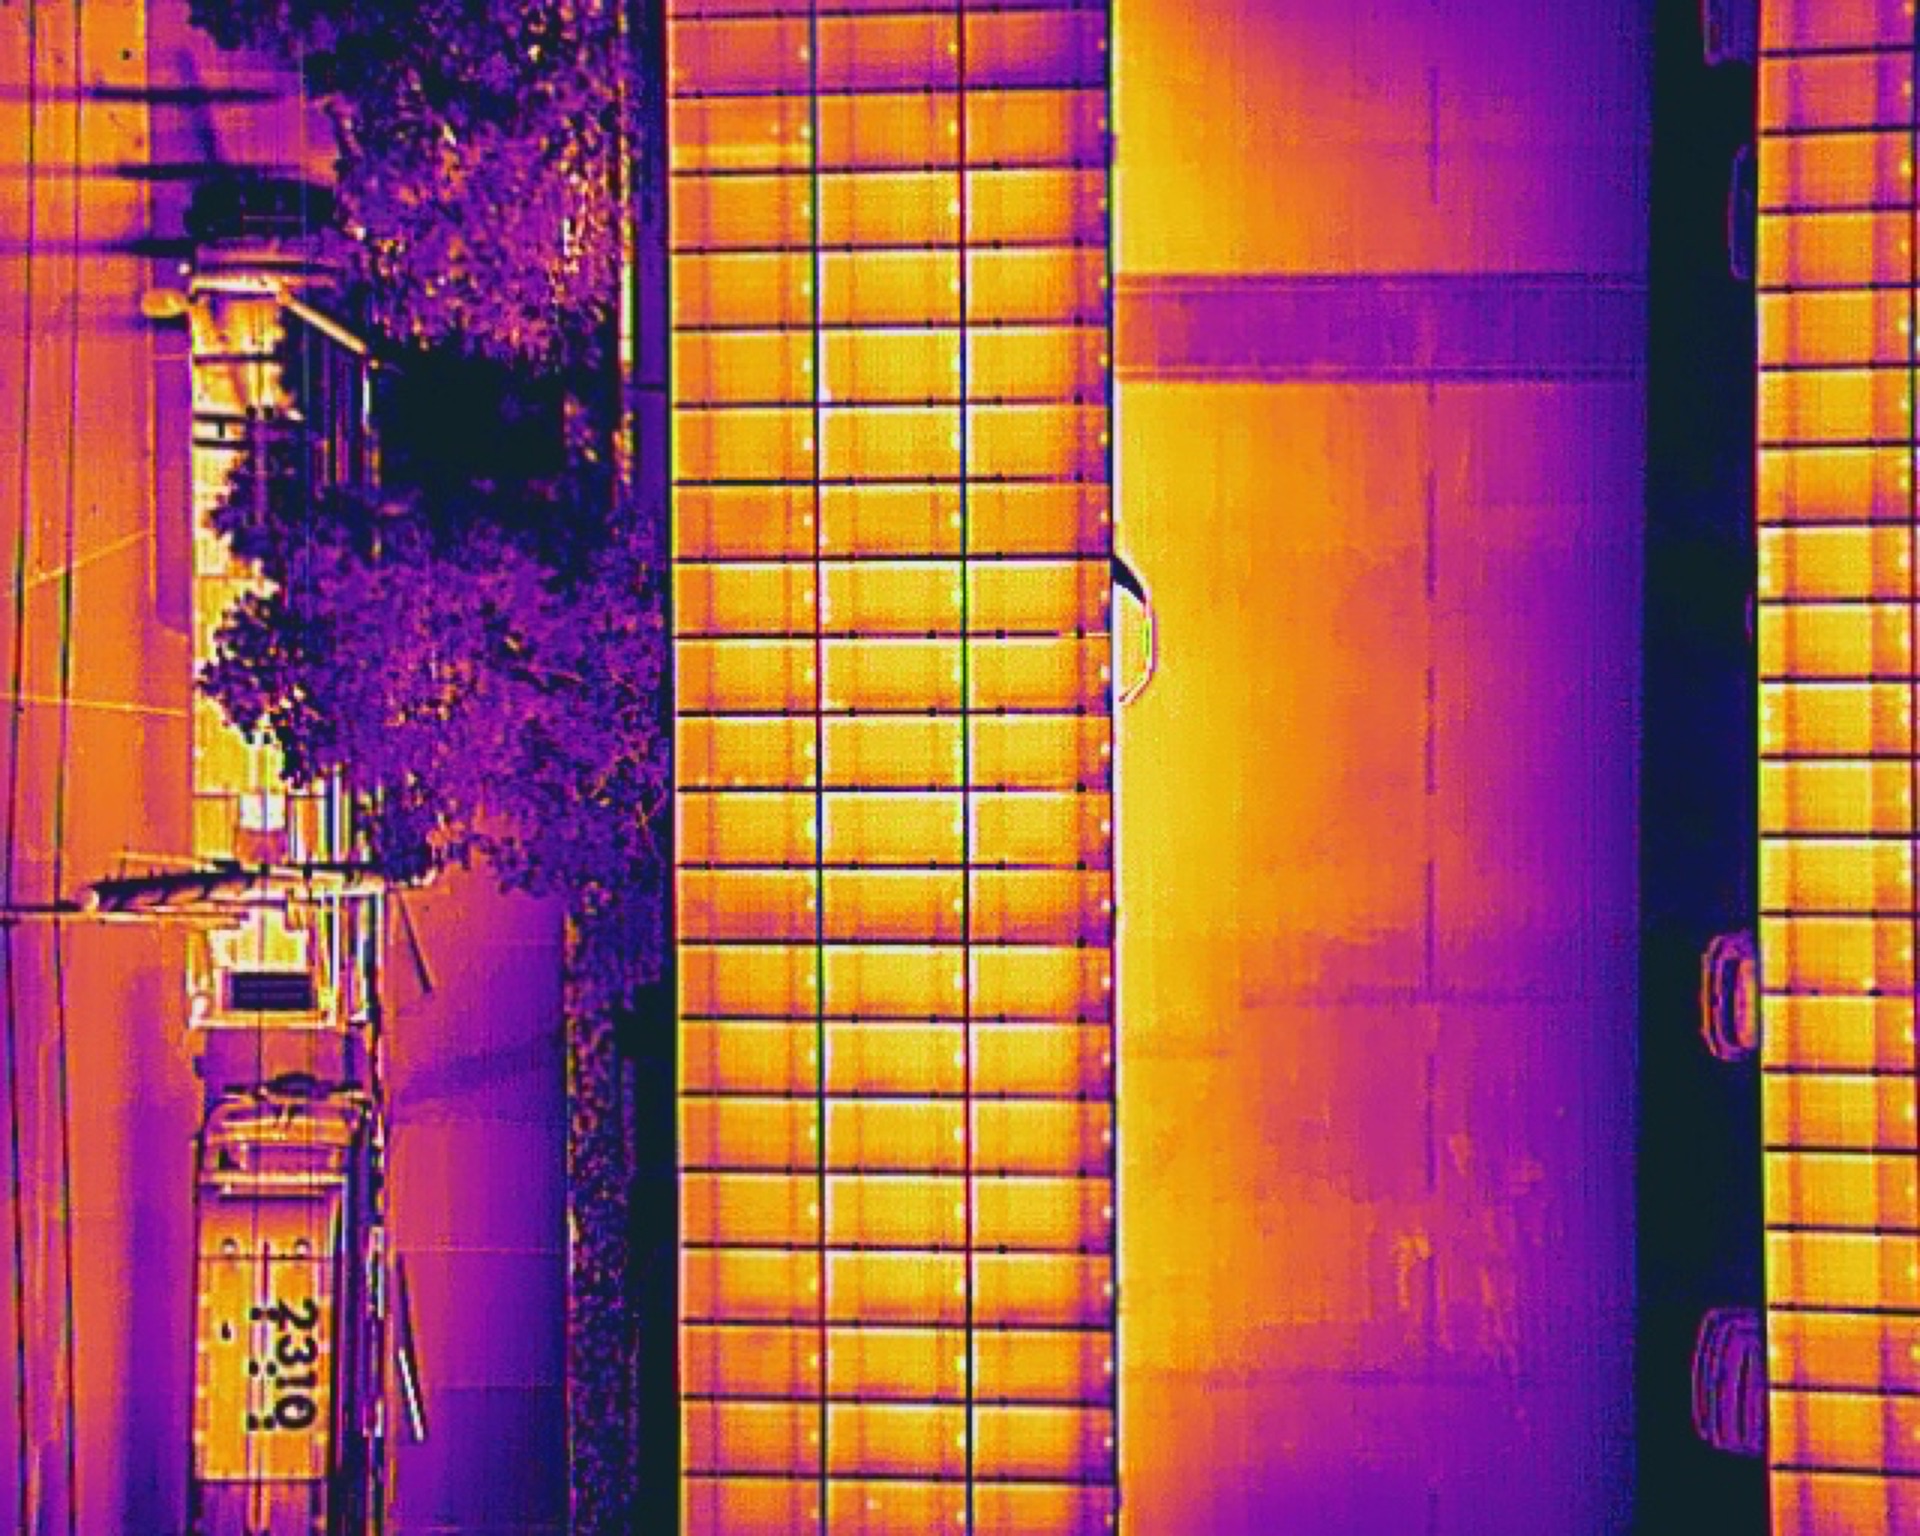
What looks fine in visible light tells a different story in thermal.
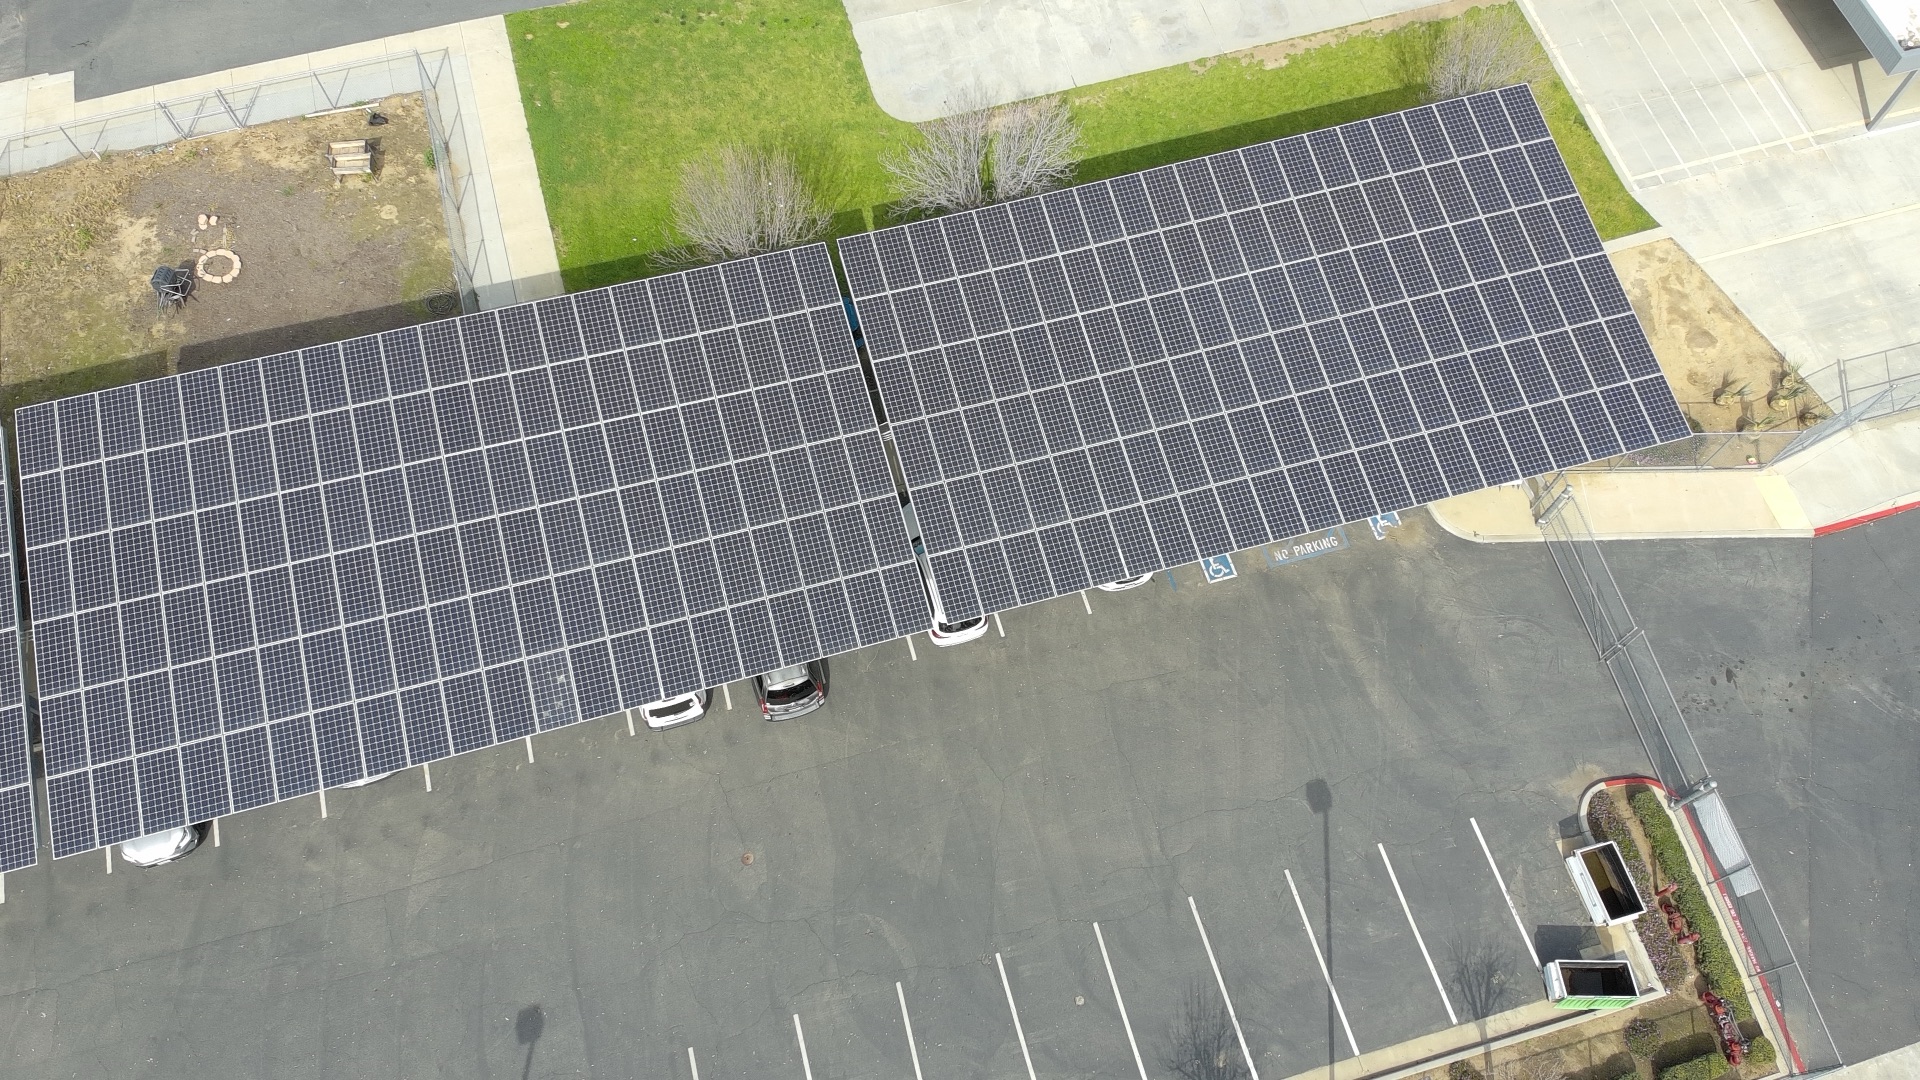
RGB — Panels look normal
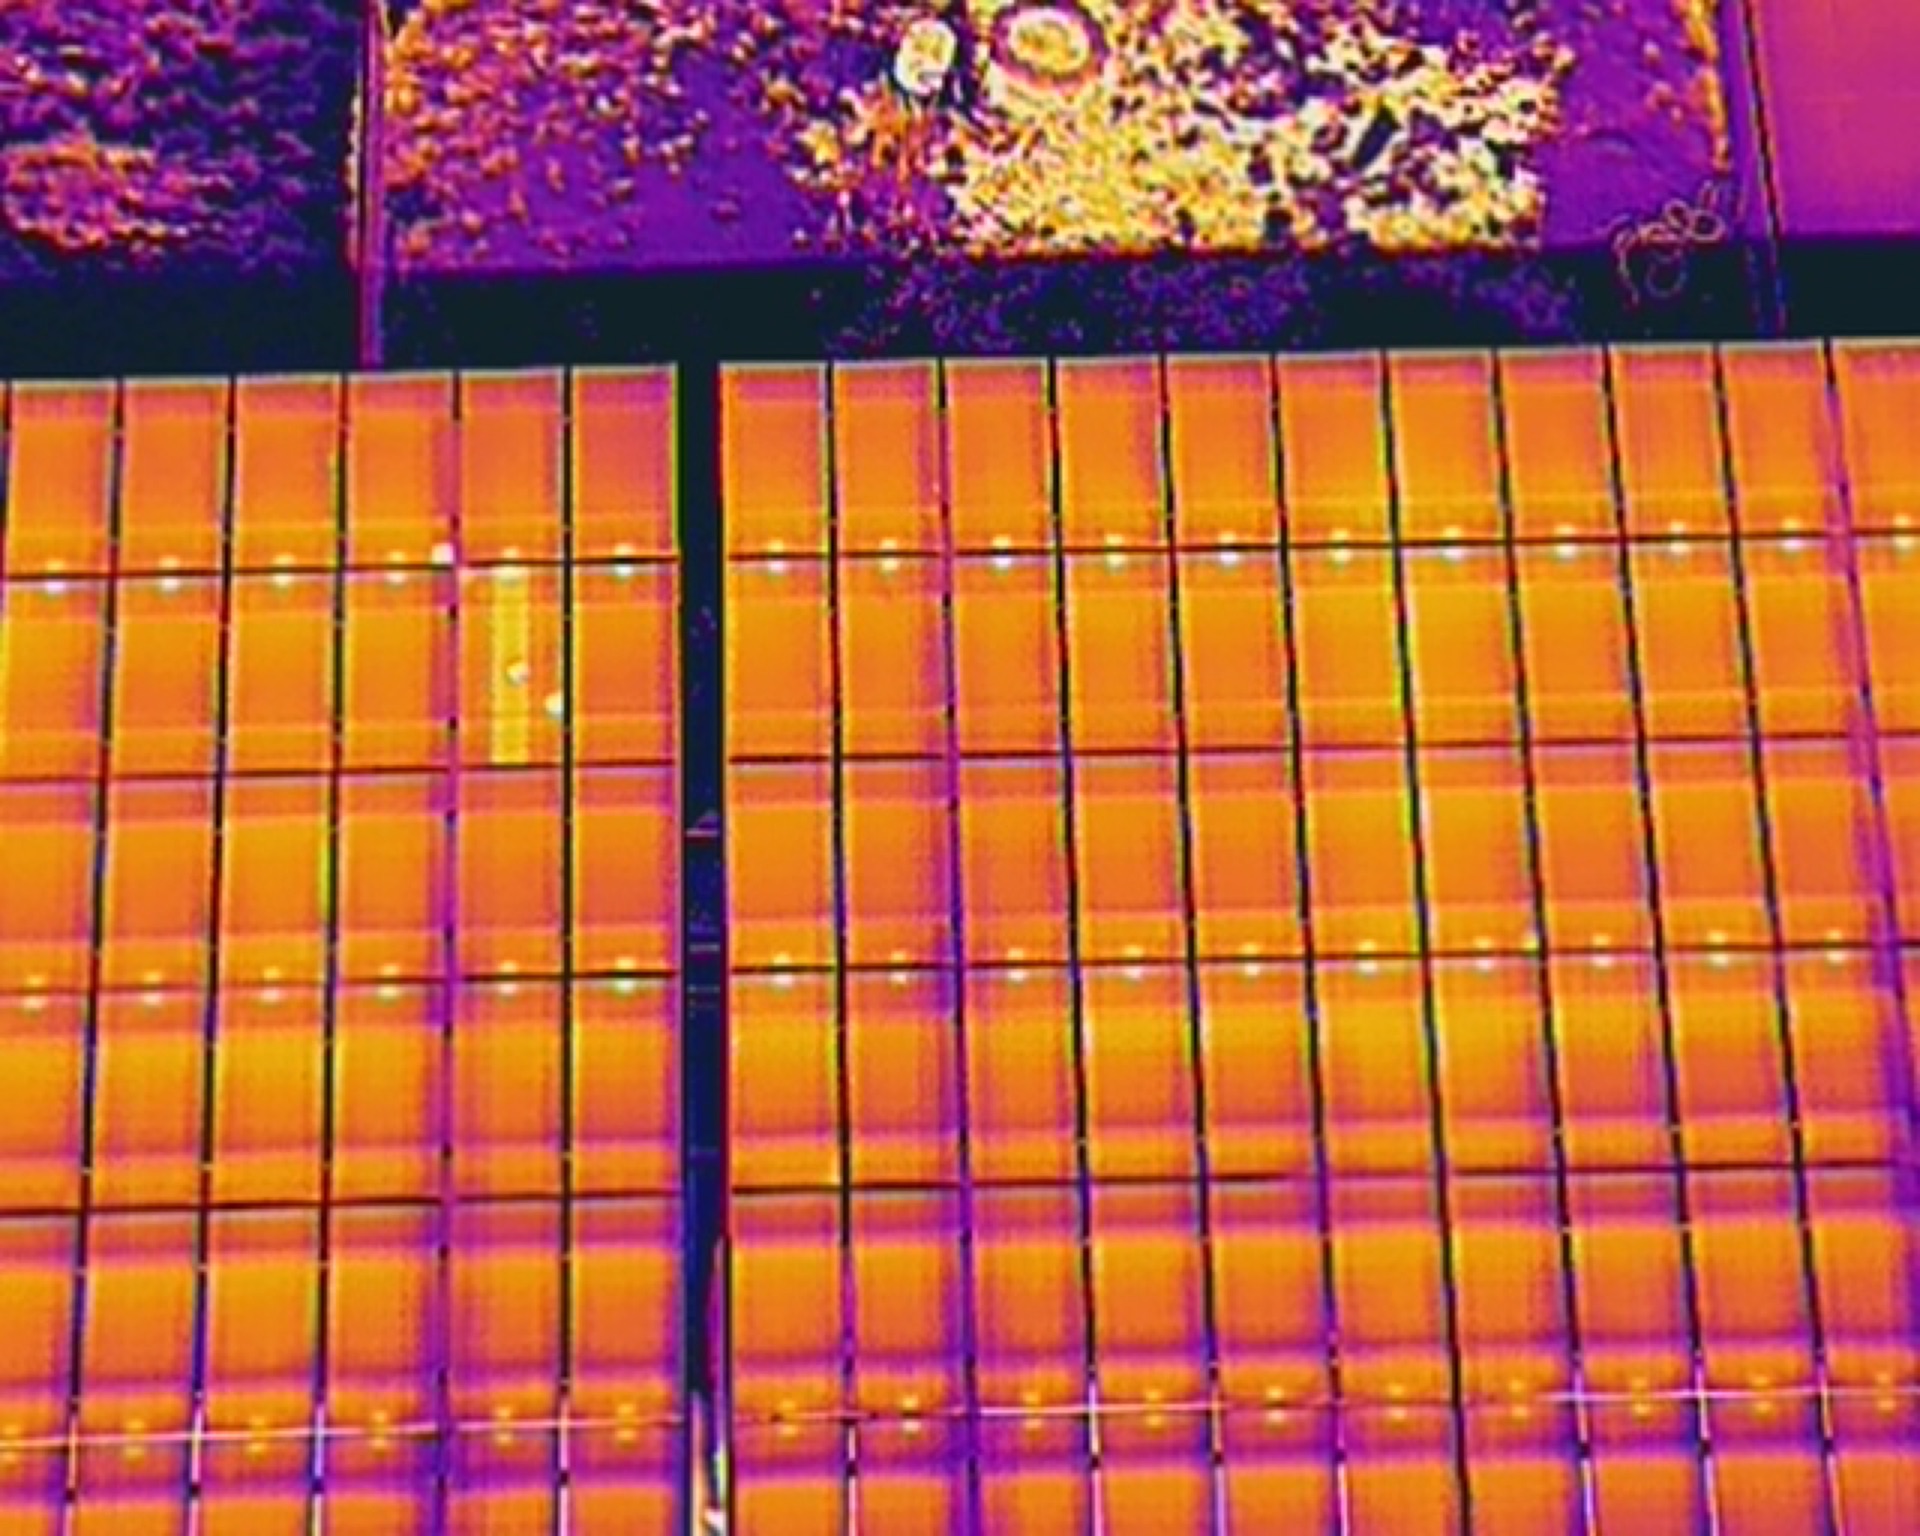
Thermal — Hotspots on failing cells
The Process
Scope
You tell us about your site — system size, location, any known issues. We plan the flight.
Fly
We fly your array with thermal and RGB sensors. The whole thing takes half a day. Zero disruption.
Analyze
Thermal data is processed, stitched, and analyzed. Every anomaly is classified and geolocated.
Report
You receive a structured report with mapped defects, severity classifications, and recommended actions.
What's in the Report
Full Thermal Orthomosaic
Your entire array stitched into a single, georeferenced thermal map
Defect Catalog
Every anomaly listed with GPS coordinates, thermal delta, severity, and close-up imagery
Severity Classification
Issues ranked by impact — critical, moderate, and monitor — prioritized for maintenance planning
High-Resolution RGB Imagery
Aerial photos of your full installation for visual documentation and planning
Executive Summary
Overall system health, estimated production loss, and recommended next steps
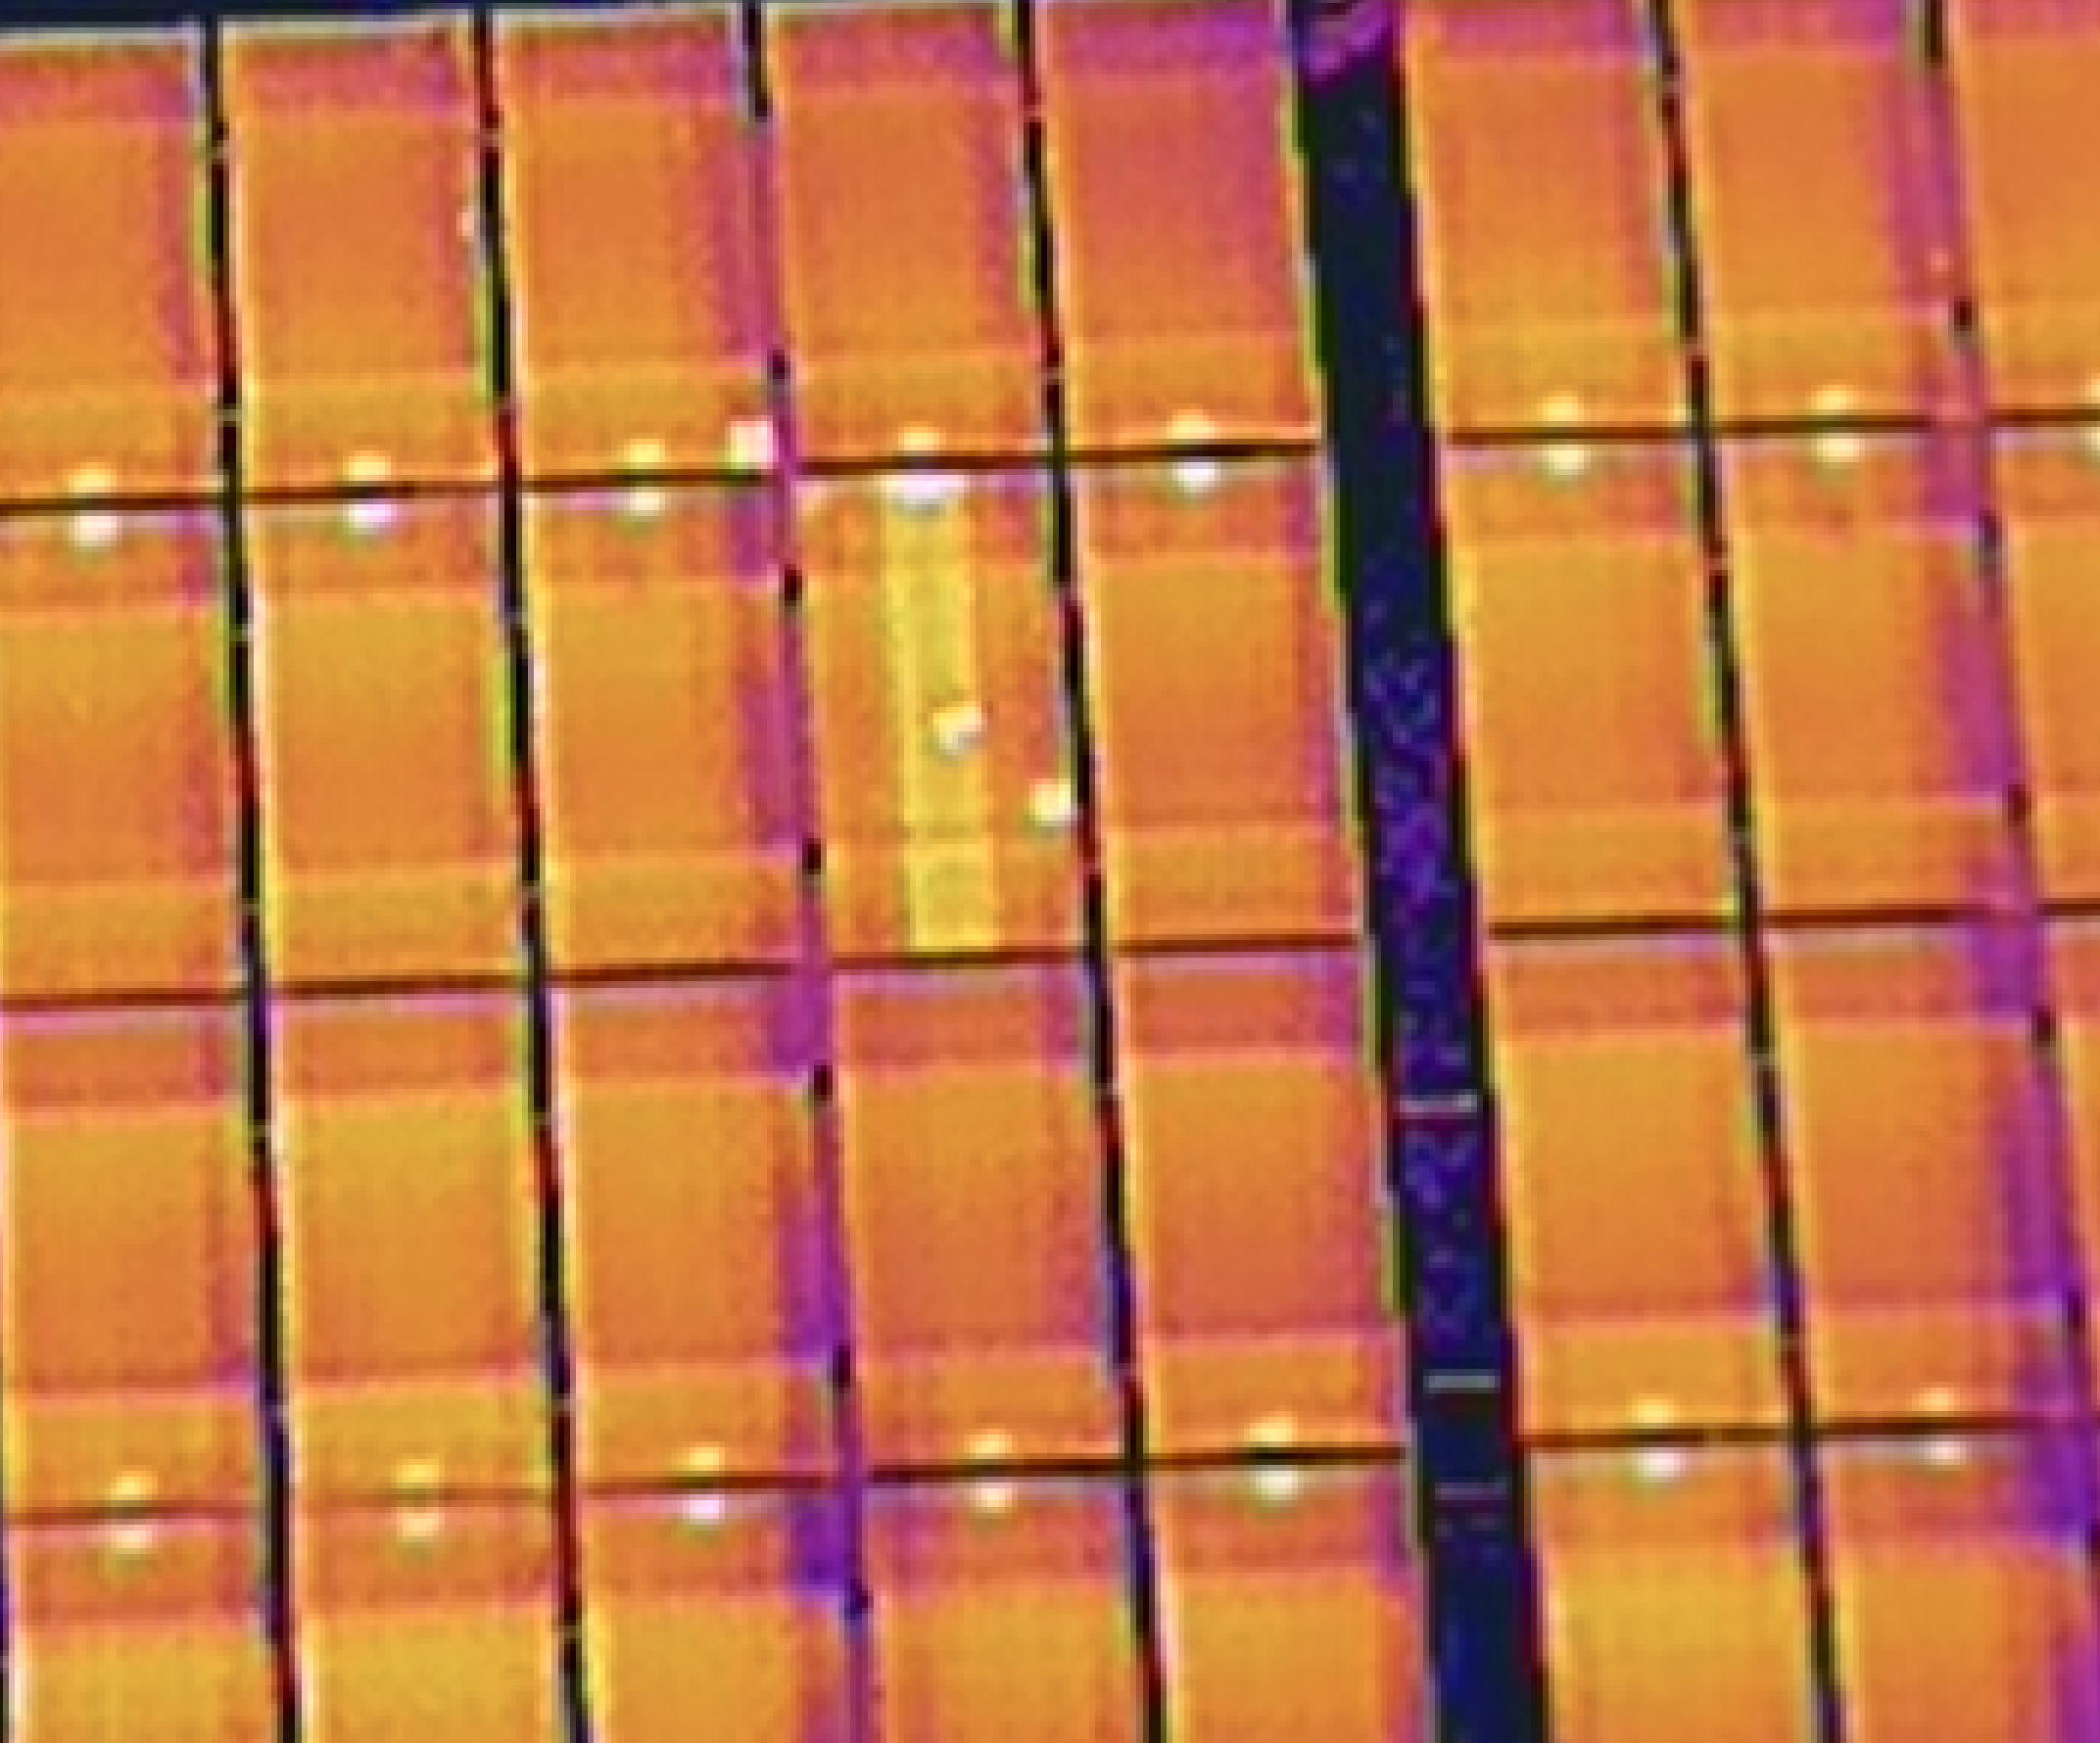
Close-up thermal: individual cell hotspots clearly visible for defect cataloging
Get Started
Tell us about your installation and we'll scope an inspection plan for your site.
Schedule an Inspection